The Only Step-by-Step Gremlin Debugger
Debug Gremlin traversals like you debug code. Step through each operation, see intermediate results highlighted on the graph, and find exactly where queries go wrong.
Why Gremlin Queries Need a Debugger
Gremlin queries are compositional — each step transforms the traverser set from the previous step. When a complex query returns unexpected results, it's almost impossible to tell which step went wrong by looking at just the input and output. You need to see the intermediate state.
Traditional debugging approaches for Gremlin involve manually truncating your query at different points and re-running partial queries. This is tedious, error-prone, and slow. GremlinStudio's debugger automates this process: it parses your query into individual steps and executes them incrementally, showing you the exact state of the traverser set after each operation.
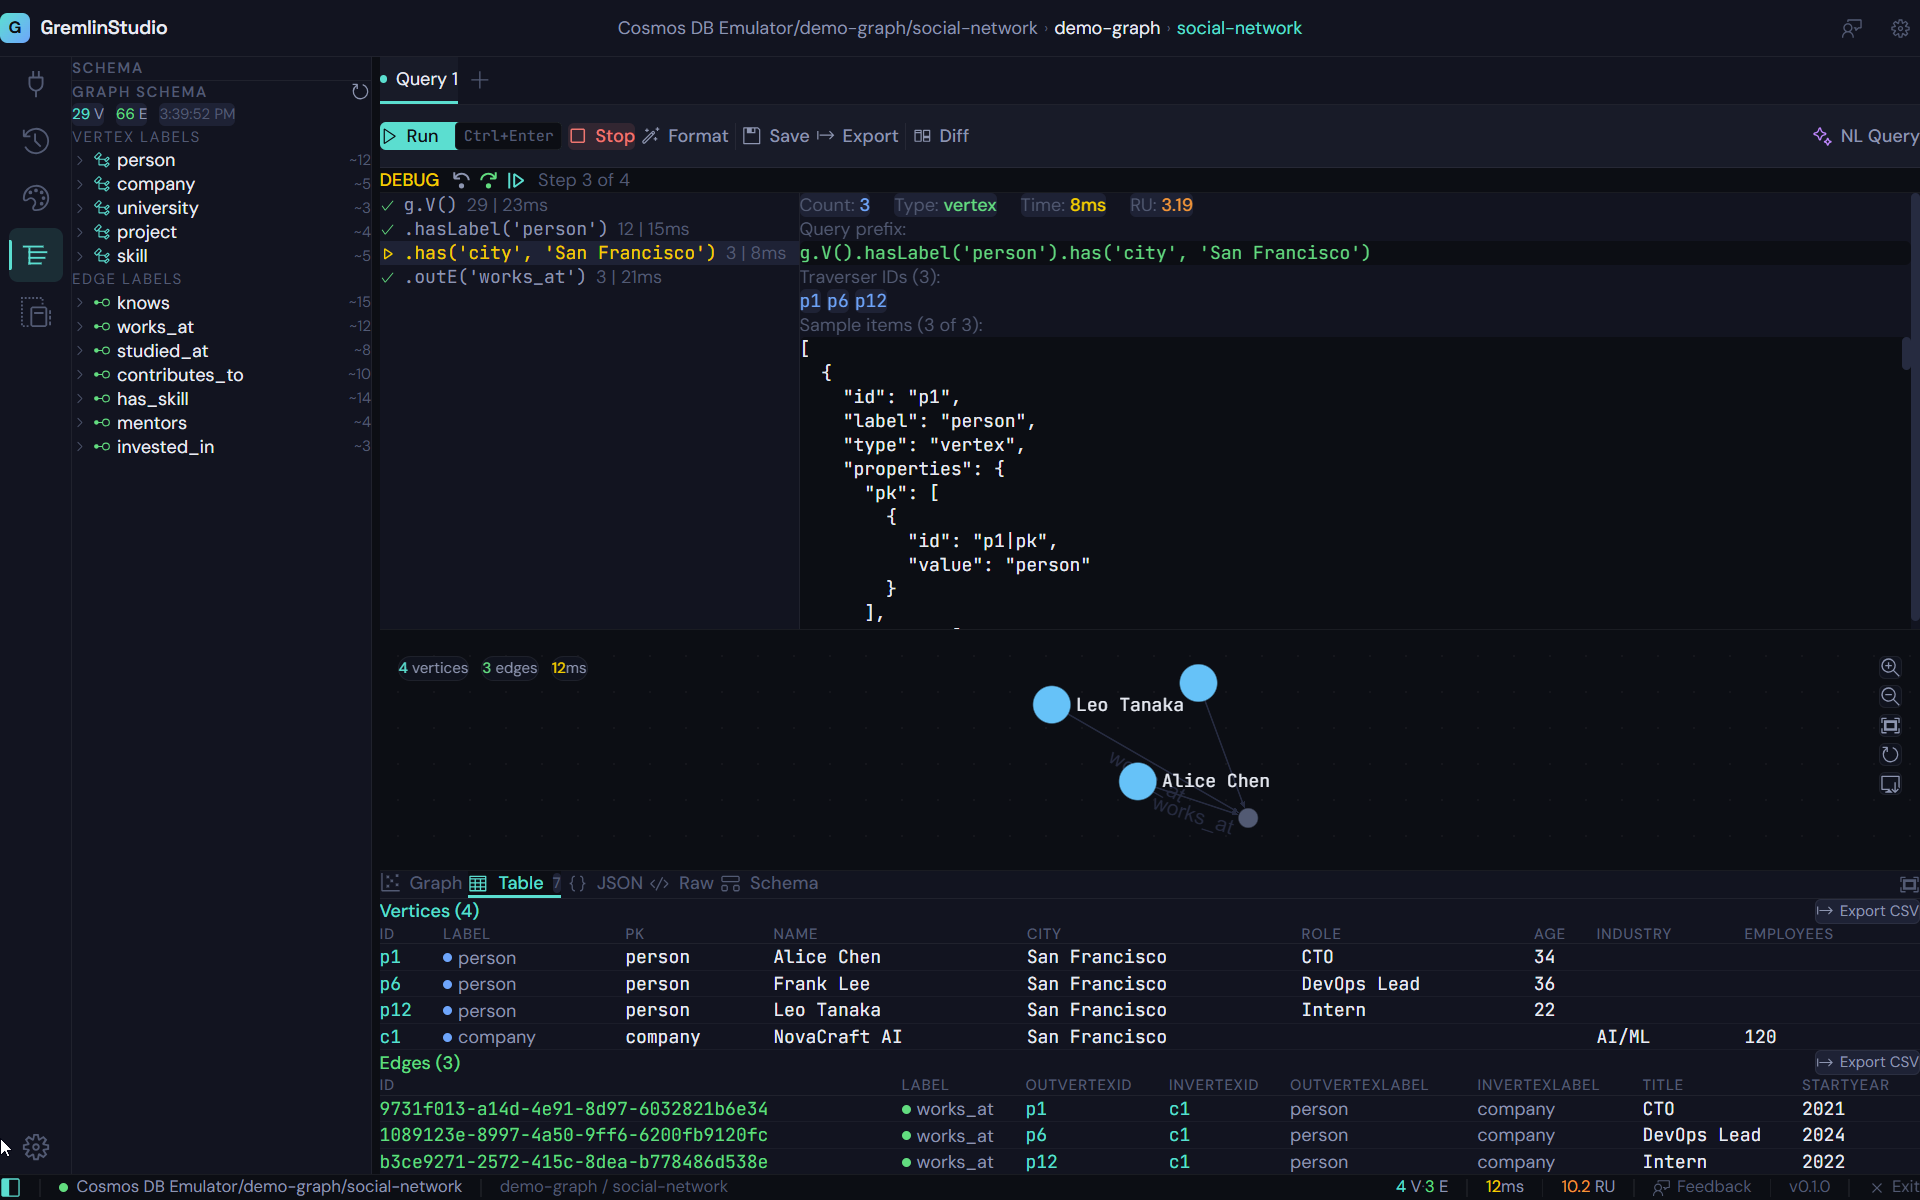
Visual Graph Highlighting
The debugger doesn't just show you text results — it highlights the current traverser set directly on the graph visualization. As you step from g.V() to .has('label', 'person') to .out('knows'), you see the highlighted nodes change in real time. Vertices that leave the traverser set fade out. New vertices that enter light up.
This visual feedback makes abstract Gremlin concepts concrete. You can see how .out() follows edges, how .has() filters vertices, and how .repeat() expands the traversal. Whether you're debugging a production query or learning Gremlin for the first time, the visual debugger makes the invisible visible.
Step-by-Step Execution
Execute Gremlin traversals one step at a time. See intermediate results after each step — V(), has(), out(), values() — to understand exactly how your query transforms the data.
Visual Traverser Highlighting
As you step through a query, the graph visualization highlights which vertices and edges are in the current traverser set. See your data light up step by step.
Run to End
Don't need to step through everything? Click "Run to End" to execute the remaining steps at once and jump to the final result.
Intermediate Result Inspection
At each step, inspect the full result set in table, JSON, or raw format. Understand what data your traversal is working with before moving to the next step.
Query Diff
Compare two query results side by side. See exactly how changing a filter, adding a step, or modifying a predicate affects your output.
Breakpoint-Like Control
Step forward through your traversal like stepping through code in a debugger. Understand causality: which step filtered out a vertex, which step added an edge.
Who is this for?
Debugging Unexpected Results
When a Gremlin query returns the wrong data, step through it to find exactly where the traversal diverges from your expectation.
Understanding Complex Traversals
Multi-step traversals with repeat(), coalesce(), or union() can be hard to reason about. The debugger makes the data flow visible.
Teaching and Learning Gremlin
New team members can step through example queries to understand how Gremlin steps transform the traversal. Visual highlighting makes abstract concepts concrete.
Performance Investigation
Identify which step in a long traversal is producing unexpectedly large intermediate result sets, helping you optimize query performance.
Ready to try GremlinStudio?
7-day free trial with all Pro features. No credit card required.
Download Free Trial