Interactive Graph Database Visualization
See your Azure Cosmos DB graph data come alive. Force-directed layouts, custom style rules, edge arrows, WYSIWYG editing, and full-screen exploration.
Why Visualize Graph Data?
Graph databases store relationships as first-class citizens, but most tools show you tables and JSON. That's like reading sheet music without hearing the melody. Visualization reveals the patterns, clusters, and anomalies in your data that are impossible to see in text form.
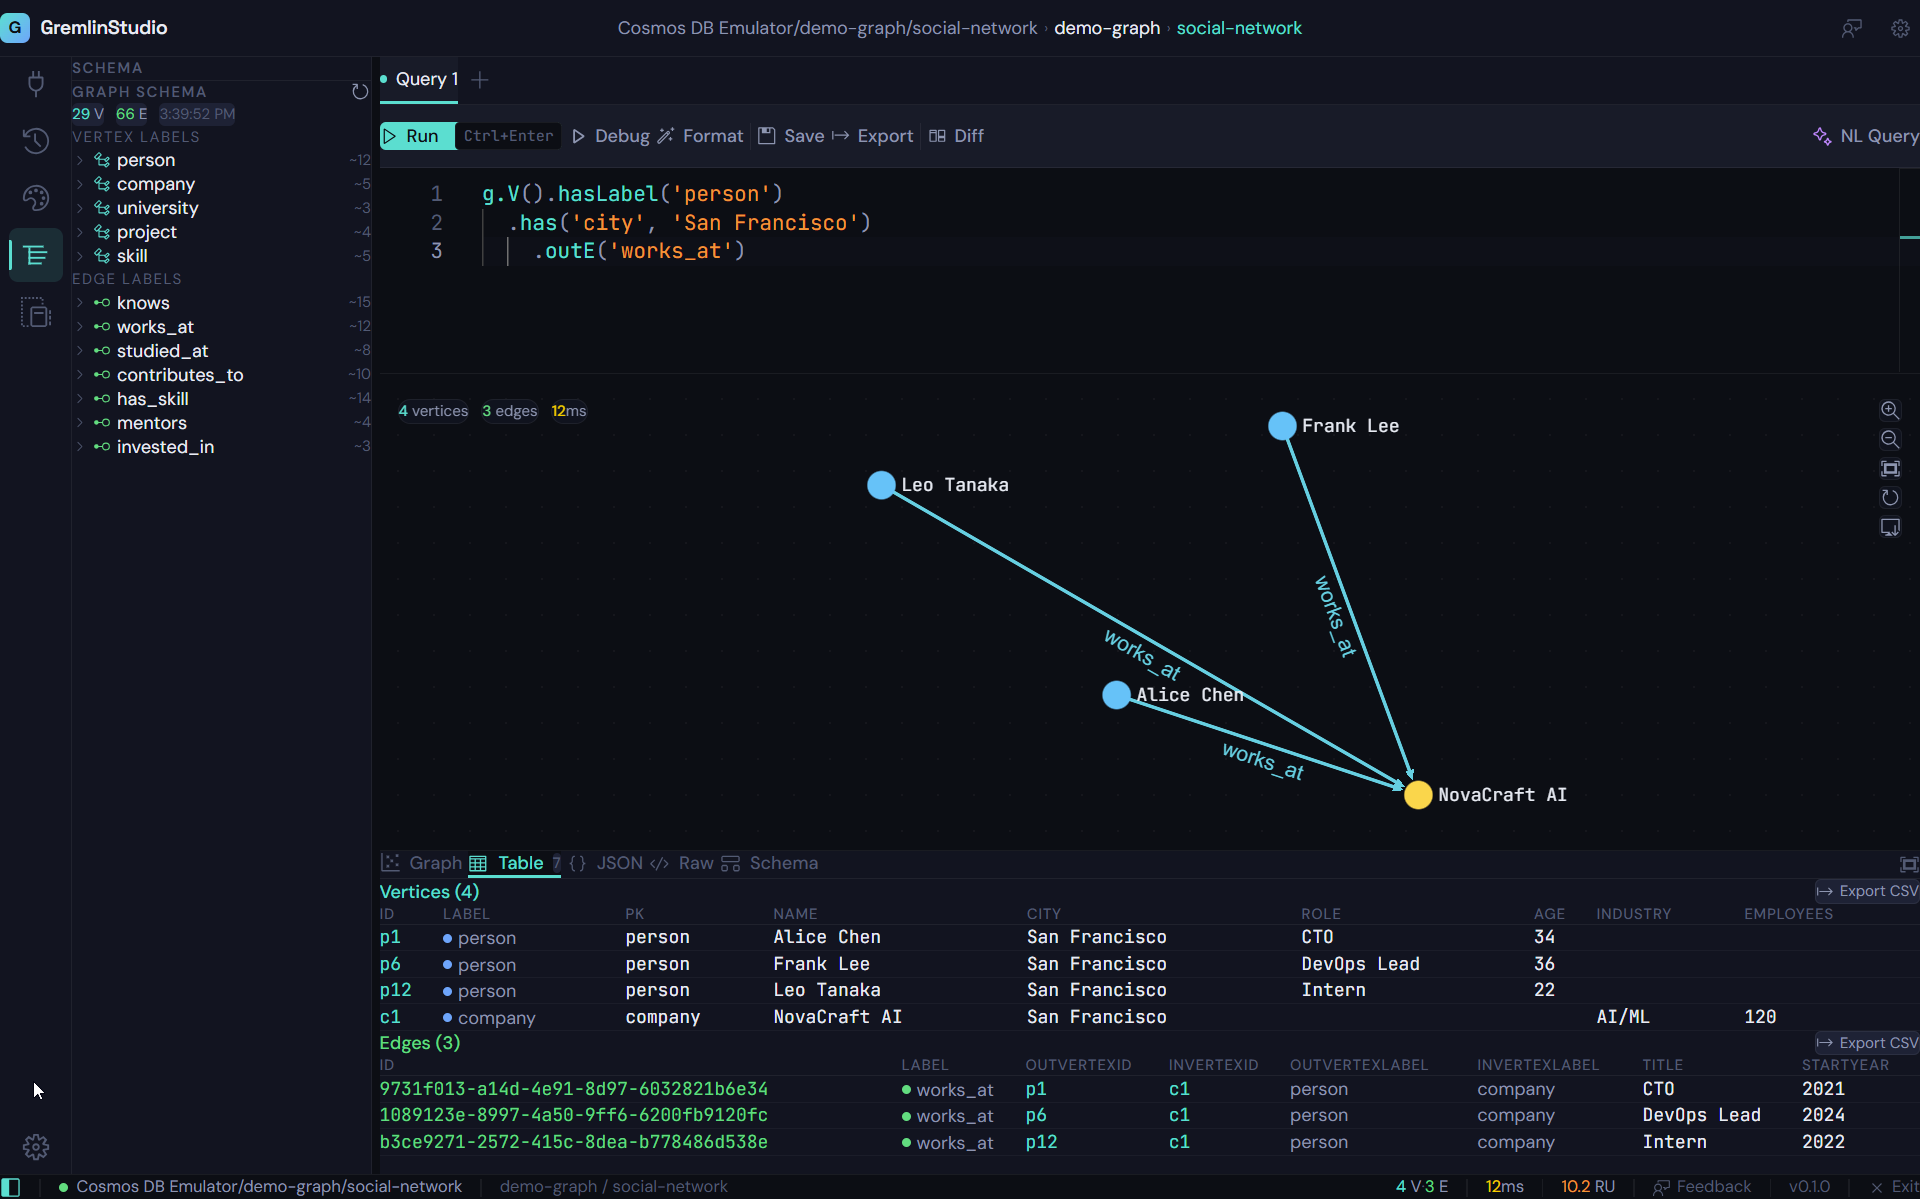
GremlinStudio uses Sigma.js v3 with the Graphology library to render your query results as interactive graph visualizations. The ForceAtlas2 layout algorithm automatically positions nodes so that connected entities cluster together, making relationship patterns immediately visible.
Style Rules for Clear Communication
Raw graph visualizations can be overwhelming. GremlinStudio's style rule engine lets you assign colors by vertex label, size nodes by property values, and apply conditional formatting based on any attribute. A well-styled graph communicates instantly: blue nodes are users, green nodes are products, large nodes have many connections.
Style rules are saved to your profile and applied automatically to every query result. Import and export them as JSON to share consistent visual standards across your team.
Force-Directed Layout
Powered by ForceAtlas2, your graph automatically arranges itself so clusters and relationships are visually clear. Drag nodes to rearrange, zoom to explore.
Edge Arrows & Labels
See the direction of relationships at a glance with arrow-headed edges. Edge labels show relationship types so you understand the connections in your data.
Custom Style Rules
Color nodes by label, size them by property values, and apply conditional styling rules. Create visual distinctions that make your graph data immediately understandable.
Full-Screen Mode
Expand the graph visualization to fill your entire screen. Perfect for presentations, exploration sessions, and understanding large graph structures.
WYSIWYG CRUD
Right-click any node or edge to create, edit, or delete data directly on the graph canvas. No need to write Gremlin for simple data operations.
Click-to-Inspect
Click any node to see all its properties in the details panel. Click a row in the table view to highlight the corresponding node on the graph.
Who is this for?
Exploring Relationships
See how entities connect in your graph database. Identify clusters, hubs, and outliers that are invisible in tabular data.
Presentations & Demos
Show stakeholders the structure of your graph data in full-screen mode. Style rules make the visualization clear and professional.
Data Quality Checks
Visually spot orphaned nodes, missing edges, or unexpected connection patterns. The graph view reveals structural issues that queries alone might miss.
Schema Understanding
Combine schema discovery with graph visualization to understand the structure of a graph database you did not build.
Ready to try GremlinStudio?
7-day free trial with all Pro features. No credit card required.
Download Free Trial